Darf auf keinem Home Assistant fehlen!  System Monitor richtig nutzen
Du willst wissen, ob dein Home Assistant überlastet ist oder warum er plötzlich langsam reagiert? In diesem Video zeige ich dir den System Monitor – ein echtes Must-Have für jede Installation! 
Wir schauen uns gemeinsam an, wie du ihn einfach über die GUI installierst, alle wichtigen Entitäten im Blick behältst und sogar Automationen erstellst, um bei auffälligen Werten benachrichtigt zu werden – ganz ohne YAML! 
Außerdem: Warum der System Monitor deutlich mehr zeigt als die Standardauslastung und dir sogar bei der Fehlersuche hilft! 
6 „Gefällt mir“
Habe ich schon eine ganze Weile laufen. Kann aber nicht schaden das Thema mal aufzugreifen.
1 „Gefällt mir“
yo, läuft bei mir auch schon seit längerem. inkl. Memory und Swap Überwachung, die einen Neustart im Falle von sehr hoher Auslastung über mehrere Stunden führt, natürlich mit Benachrichtigung vorher und auch nur zu bestimmten Tageszeiten.
3 „Gefällt mir“
Sehr nützliche Integration, habe ich auch seit Beginn von HA in Benutzung und gefällt mir richtig gut, weil man halt wirklich mehr Informationen erhält, wie mit dem Standard in HA und man kann sich sein eigenes Dashboard anlegen.
5 „Gefällt mir“
Habe ich auch schon länger im Einsatz
(natürlich noch mit custom:bar-card  )
)
2 „Gefällt mir“
Du musst es natürlich wie immer gleich mit dem sehr schön gelungenem Dashboard übertreiben 
5 „Gefällt mir“
Kennst mich doch, Optik ist mir halt immer wichtig. 
5 „Gefällt mir“
Bar Cards sind eine gute Idee, auch wenn sie ein bisschen mehr Platz einnehmen.
=> Werde bei mir wohl die Darstellung der meisten numerischen Werte mit der entity-progress-card  ersetzen
2 „Gefällt mir“
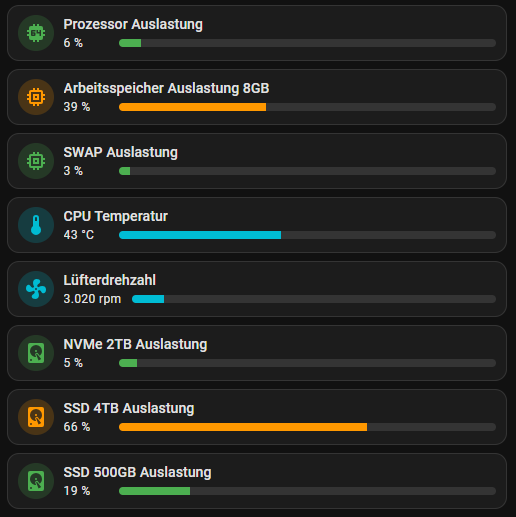
ist gerade erledigt und ist jetzt (grob) angelegt mit custom:entity-progress-card 
3 „Gefällt mir“
Ich glaube du solltest solangsam deine Board hier nach und nach Stück für Stück erklären zum bessern nachbauen..
Ne im ernst super Arbeit von dir immer… Weiter so
5 „Gefällt mir“
Hi, hier mal nur der Codeausschnitt für mein Dashboard zum System Monitor.
Ihr findet ansonsten die Codes auch immer bei mir im github. 
https://github.com/jayjojayson/HA_homedashboard/blob/main/Unterseiten/1%20Einstellungen/raspi-gerate-zigbee-homematic-tabbed-card.yaml
type: custom:stack-in-card
card_mod:
  style: |
    ha-card {
      padding: 25px;
      box-shadow: rgba(0, 0, 0, 0.4) 0px 2px 4px, rgba(0, 0, 0, 0.3) 0px 7px
                  13px -3px, rgba(0, 0, 0, 0.2) 0px -3px 0px inset !important;
      border: none;
    }
cards:
  - type: custom:layout-card
    layout_type: custom:grid-layout
    layout:
      grid-template-columns: 15% 25% 60%
      grid-template-rows: auto
      mediaquery:
        "(max-width: 1000px)":
          grid-template-columns: 100%
          grid-template-rows: auto
    cards:
      - type: vertical-stack
        cards:
          - type: picture-entity
            card_mod:
              style: |
                ha-card {
                  background: none !important;
                  box-shadow: none !important;
                  border: none !important;
                  border-radius: 0px !important;
                }
            camera_view: auto
            image: /api/image/serve/ca4c05698bc1567f27c5460b28284ea7/512x512
            entity: sensor.system_monitor_prozessornutzung
            show_state: false
            show_name: false
          - type: custom:button-card
            card_mod:
              style: |
                ha-card {
                  background: none !important;
                  box-shadow: none !important;
                  border: none !important;
                  border-radius: 0px !important;
                }
            entity: sensor.system_monitor_prozessornutzung
            name: " "
            icon: mdi:cpu-64-bit
            show_state: true
            size: 20%
            styles:
              card:
                - padding: 0px
                - font-size: 20px
              icon:
                - padding-bottom: 5px
                - width: 30px
                - height: 30px
            tap_action:
              action: call-service
              service: input_select.select_option
              service_data:
                entity_id: input_select.diagramm_anzeige
                option: Temperatur
          - type: custom:button-card
            card_mod:
              style: |
                ha-card {
                  background: none !important;
                  box-shadow: none !important;
                  border: none !important;
                  border-radius: 0px !important;
                }
            entity: sensor.system_monitor_arbeitsspeicherauslastung
            name: " "
            icon: mdi:memory
            show_state: true
            size: 20%
            styles:
              card:
                - padding-top: 5px
                - font-size: 20px
              icon:
                - padding-bottom: 5px
                - width: 30px
                - height: 30px
            tap_action:
              action: call-service
              service: input_select.select_option
              service_data:
                entity_id: input_select.diagramm_anzeige
                option: RAM
      - type: vertical-stack
        cards:
          - type: entities
            card_mod:
              style: |
                ha-card {
                  background: none !important;
                  box-shadow: none !important;
                  border: none !important;
                  border-right: 1px solid grey !important;
                  border-left: 1px solid grey !important;
                  border-radius: 0px !important;
                }
            entities:
              - entity: sensor.system_monitor_prozessortemperatur
                name: CPU Temp
              - entity: sensor.system_monitor_belegter_arbeitsspeicher
                name: RAM Belegt
              - entity: sensor.system_monitor_freier_arbeitsspeicher
                name: RAM Frei
              - entity: sensor.system_monitor_belegter_massenspeicher
                name: SSD Belegt
              - entity: sensor.system_monitor_freier_massenspeicher
                name: SSD Frei
              - entity: sensor.system_monitor_letzter_systemstart
                name: Letzter Restart
                icon: mdi:restart
            theme: grey-icon
            state_color: false
            show_header_toggle: true
      - type: vertical-stack
        cards:
          - type: conditional
            conditions:
              - entity: input_select.diagramm_anzeige
                state: Temperatur
            card:
              type: custom:mini-graph-card
              card_mod:
                style: |
                  ha-card {
                    padding: 20px !important;
                    background: none !important;
                    box-shadow: none !important;
                    border: none !important;
                    border-radius: 0px !important;
                  }
              entities:
                - entity: sensor.system_monitor_prozessortemperatur
                  name: CPU-Temp
                  show_state: true
                  show_min: true
                  show_max: true
                - entity: sensor.system_monitor_prozessornutzung
                  name: CPU-Auslastung
                  show_state: true
                  show_min: true
                  show_max: true
              hours_to_show: 168
              points_per_hour: 1
              show:
                legend: true
                labels: true
                name: false
                state: true
                icon: false
              color_thresholds:
                - value: 0
                  color: "#1e90ff"
                - value: 50
                  color: "#ffa500"
                - value: 80
                  color: "#ff4500"
              more_info: true
          - type: conditional
            conditions:
              - entity: input_select.diagramm_anzeige
                state: RAM
            card:
              type: custom:mini-graph-card
              card_mod:
                style: |
                  ha-card {
                    padding: 20px !important;
                    background: none !important;
                    box-shadow: none !important;
                    border: none !important;
                    border-radius: 0px !important;
                  }
              entities:
                - entity: sensor.system_monitor_belegter_arbeitsspeicher
                  name: RAM-Nutzung
                  show_state: true
                  show_min: true
                  show_max: true
                - entity: sensor.system_monitor_arbeitsspeicherauslastung
                  name: RAM-Auslastung
                  show_state: true
                  show_min: true
                  show_max: true
              hours_to_show: 168
              points_per_hour: 1
              show:
                legend: true
                labels: true
                name: false
                state: true
                icon: false
              color_thresholds:
                - value: 800
                  color: "#1e90ff"
                - value: 1500
                  color: "#ffa500"
                - value: 1700
                  color: "#ff4500"
              more_info: true
  - type: custom:mod-card
    card_mod:
      style: |
        ha-card {
            height: 1px;
            border-bottom: 1px;
            background-color: grey !important;
            margin-left: 20px;
            margin-right: 20px;
        }
  - type: custom:layout-card
    layout_type: custom:grid-layout
    layout:
      grid-template-columns: 50% 50%
      grid-template-rows: auto
      mediaquery:
        "(max-width: 1000px)":
          grid-template-columns: 100%
          grid-template-rows: auto
    cards:
      - type: vertical-stack
        cards:
          - type: custom:mini-graph-card
            card_mod:
              style: |
                ha-card {
                  padding: 10px !important;
                  background: none !important;
                  box-shadow: none !important;
                  border: none !important;
                  border-right: 1px solid grey !important;
                  border-radius: 0px !important;
                }
            entities:
              - entity: sensor.system_monitor_arbeitsspeicherauslastung
                name: Arbeitsspeicher
                show_state: true
                show_min: true
                show_max: true
            hours_to_show: 168
            points_per_hour: 1
            show:
              legend: true
              extrema: true
              labels: true
              name: false
              state: false
              icon: false
            color_thresholds:
              - value: 20
                color: "#1e90ff"
              - value: 50
                color: "#ffa500"
              - value: 80
                color: "#ff4500"
            more_info: true
      - type: vertical-stack
        cards:
          - type: custom:mini-graph-card
            card_mod:
              style: |
                ha-card {
                  padding: 10px !important;
                  background: none !important;
                  box-shadow: none !important;
                  border: none !important;
                  border-radius: 0px !important;
                }
            entities:
              - entity: sensor.system_monitor_prozessornutzung
                name: CPU-Auslastung
                show_state: true
                show_min: true
                show_max: true
            hours_to_show: 168
            points_per_hour: 1
            show:
              legend: true
              extrema: true
              labels: true
              name: false
              state: false
              icon: false
            color_thresholds:
              - value: 0
                color: "#1e90ff"
              - value: 15
                color: "#ffa500"
              - value: 35
                color: "#ff4500"
            more_info: true
2 „Gefällt mir“